Atom Tools: (all OpenSource)
If you find them useful, I would appreciate knowning about it.
If you want some custom ones built, send me
email.
Cleaned up and useful:
- BWX v0.90 finder. This one can be
used to estimate whether or not your application ought to be rebuilt using
byte/word load/store instructions. (Unless you used explicit compile-time
switches, your application isn't using these).
- v0.90 duplicate basic block finder.
A static informational tool to collect program statistics
at the Basic Block level.
- v0.90 Glacial parameter finder.
At the instruction level, glacial variables
are invariant, or very slowly changing. (Thus 'glacial')
A kind of value profiling tool.
- v0.90 Block level whole program path profiler.
WARNING: This tool will use MANY GIGABYTES of [virtual] memory.
Similar in concept to Jim Larus' Whole Program Path Profiles paper.
v0.90 Procedure level version.
(Also uses a lot of memory)
FOOTNOTE: this version may have memory leaks.
- Focused procedure path profiler
This tool is a sort of subset of the procedure level whole program path
profiler which will record the paths that a particular procedure is in.
It can be run once to figure out what procedures are 'hot' (node count)
and by setting an environment variable and re-running, it will record
all of the paths containing that procedure.
It uses _much_ less memory than the whole program profilers.
- v0.90 path crash profiler.
This tool can be used to find significantly more context in the event of
an early program exit (like a crash) than a simple stack traceback
available in a debugger.
- Instruction level value prediction tool.
I found that the results of IEEE operation instructions are predictable (in SPECfp95)
to some degree. How predictable is your application?
- Simple path profiler. Note that this
tool isn't licensed under the GPL. It can collect all of the program paths
which occur during the run of a program for a particular dataset.
- Simple path profiler.
At this point (Feb, 2007) I have no idea if there is a difference between
this version and the above version (also fast_wppp). It might simply be the
license. A moot point.
Some results (from other tools not shown here)
This is a set of statically generated results, and is directly related to
the work done on dynamic binary optimization
investigations which were presented at the
HotChips 11 conference in August, 1999.
It shows the path-based behavior of one of the SPECint95 programs.
 This is a graph of the total number of paths executed over the course
of running 147.vortex from SPECint95. The phases of the program are
really quite distinct.
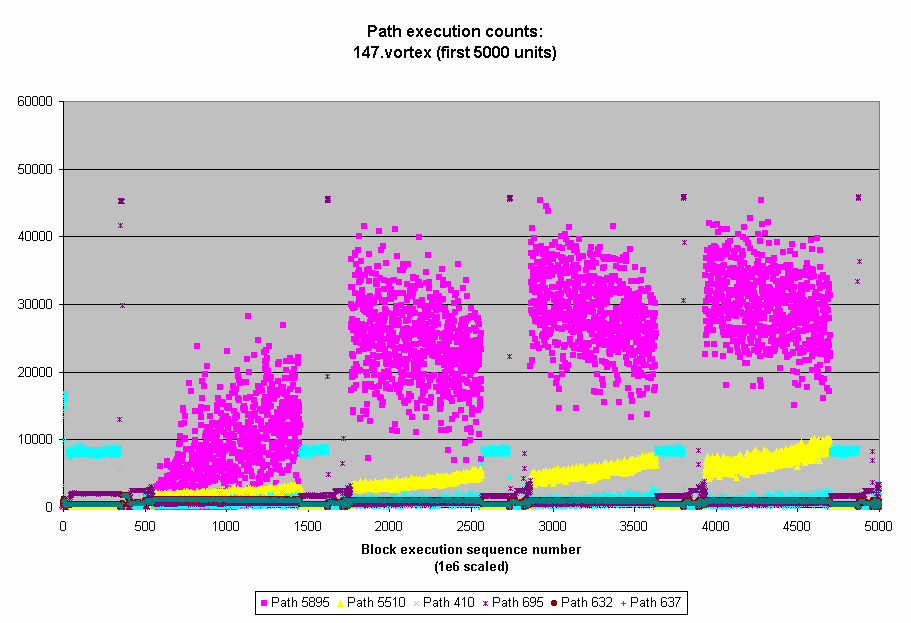 This is a closer look at the six hottest paths (by aggregate execution
count over the run of the program), bounded to the execution of
the first 5e9 basic blocks. The paths show different execution
frequencies, in visible patterns here.
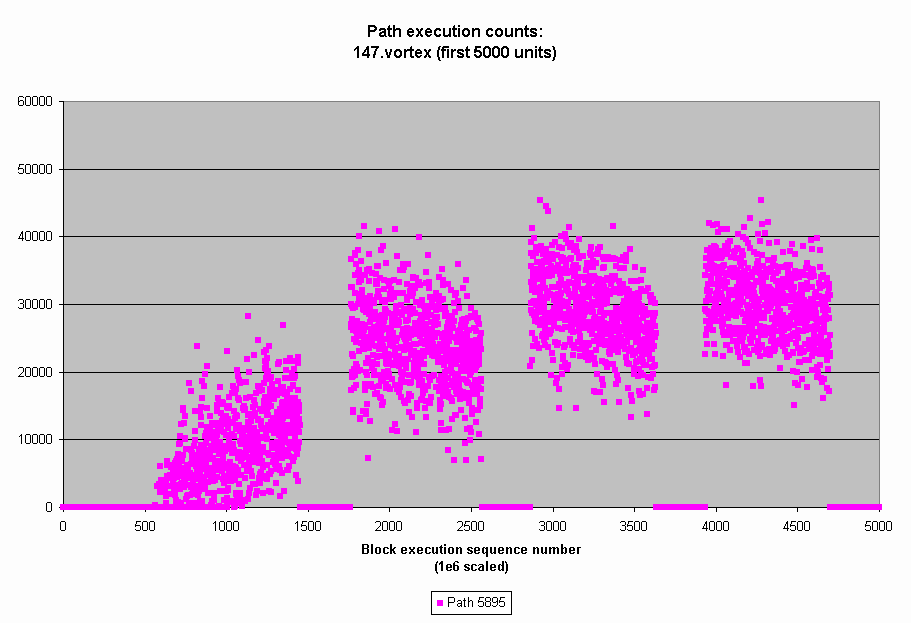
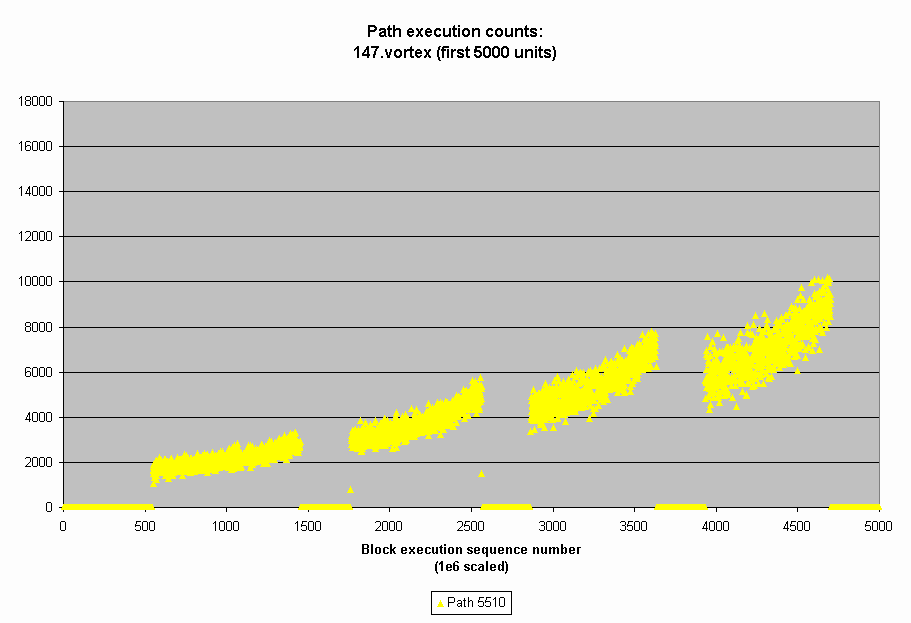
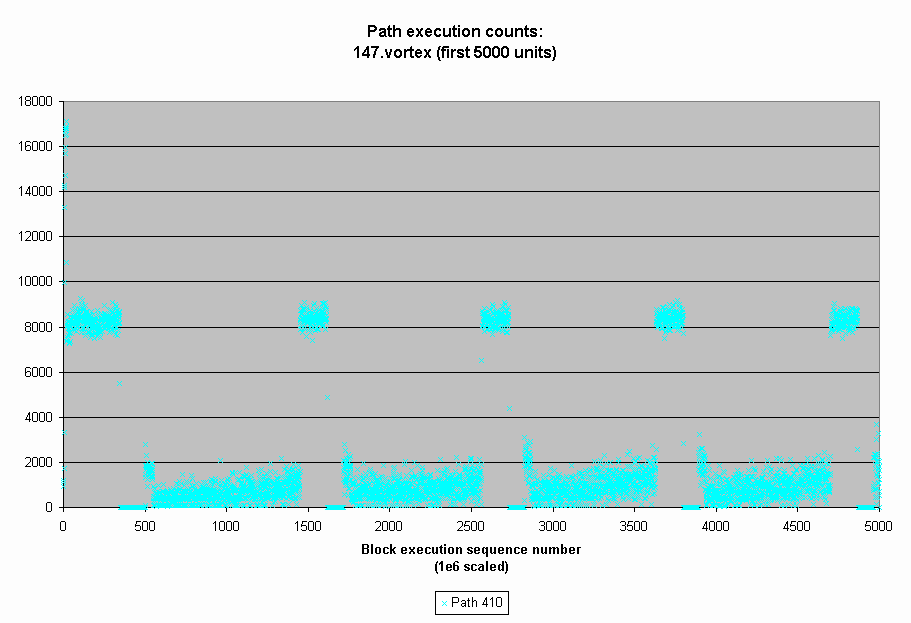
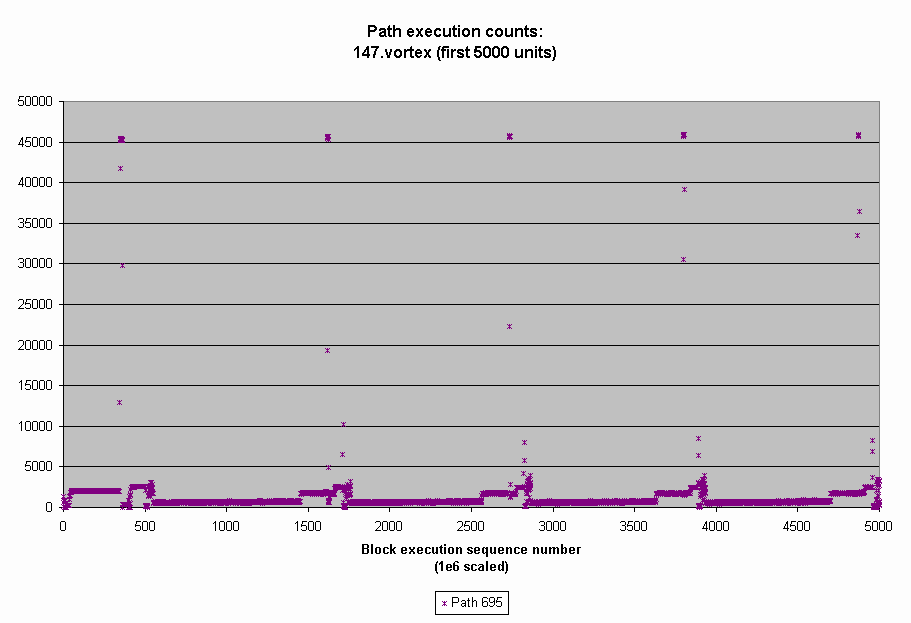
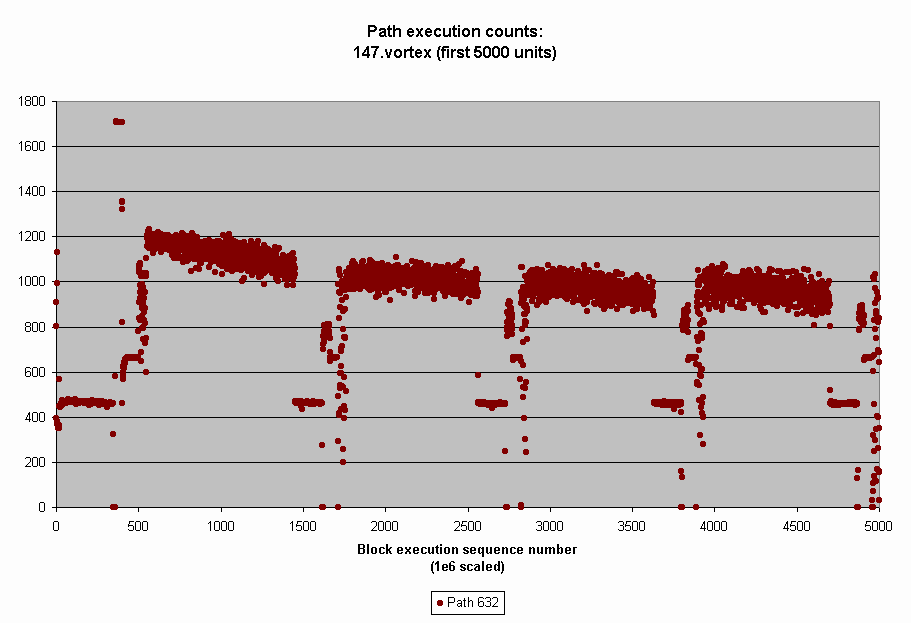
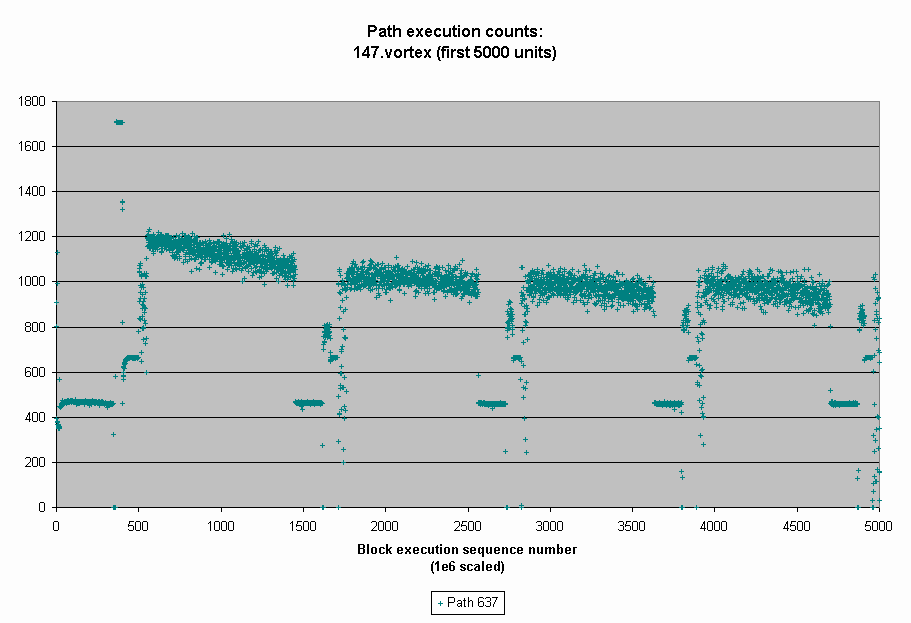 These show the individual paths by themselves, and one can get a better
sense of the phases that these paths are important during.
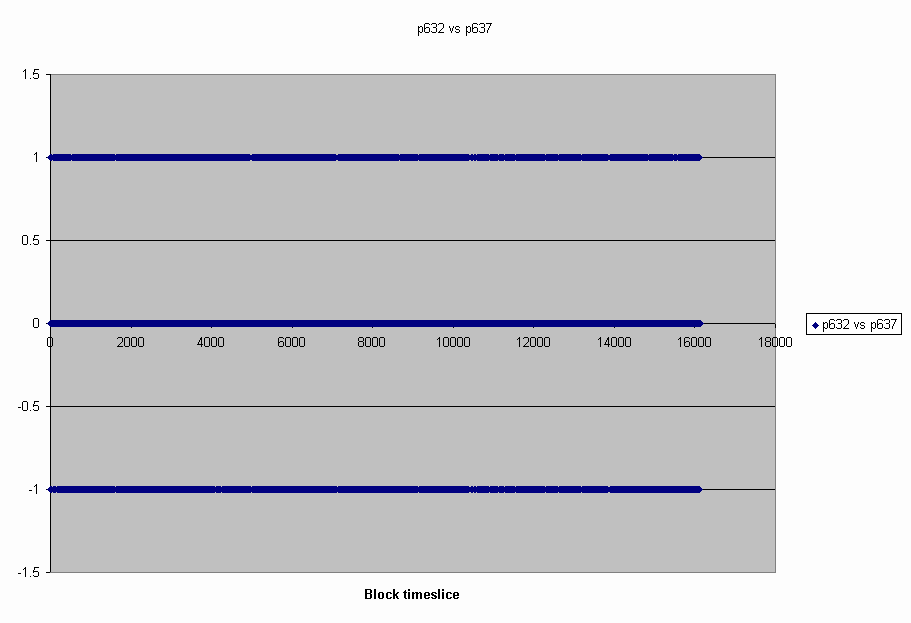
NOTE: Path #632 and Path #637 are virtually the same shape;
in fact, the difference in execution counts during the measurement
periods between these two paths is zero or one. This is shown below.

 This is a graph of the total number of paths executed over the course
of running 147.vortex from SPECint95. The phases of the program are
really quite distinct.
 This is a closer look at the six hottest paths (by aggregate execution
count over the run of the program), bounded to the execution of
the first 5e9 basic blocks. The paths show different execution
frequencies, in visible patterns here.


 These show the individual paths by themselves, and one can get a better
sense of the phases that these paths are important during.
NOTE: Path #632 and Path #637 are virtually the same shape;
in fact, the difference in execution counts during the measurement
periods between these two paths is zero or one. This is shown below.
