Path Profiling and LightWeight Profiling
Path Profiling
Path profiling is a means of collecting an increased amount of context about the
actual behavior of an application, beyond simple execution counts
on a given statement or control flow edge. That is, if a program executes
the following sequnce of functions, statements, or basic-blocks:A B C A B D B,
the paths are: ABC, ABD, B. The completion of a cycle denotes
the beginning of a new path.
Use of path profiles can yield significant benefits to developers in terms of:
- Where the compiler should optimize - because path profiles are only for those
portions of code which are actually executed, there really is no truly "cold" code.
- Where the compiler should not expend effort to optimize (code which is not executed)
- Execution Traces which span library and procedure boundaries
- What portions of the application have been tested (execution coverage):
-
If there is sufficient knowledge about source lines in the executable or as a
separate debug info file (DWARF content) QA teams could drive enhancements to
their test coverage suites.
-
Behavioral analysis - if a broad set of input datasets is consistently shown to
cover set A of paths, any deviation from that could be considered to be potential
malware and/or exploit attempts. Of course, this would need to be continuously
and dynamically checked.
-
Whitelisting analysis - via a much reduced set of code to analyze, it may become
possible to perform formal/machine proofs of the correctness of the on-path code.
Personal investigations into Path Profiling:
Larus' Whole Program Paths thoroughly captured my attention to the point of inspiring
me to attempt something similar, but via a more dynamic approach. It seemed to me that
Larus' approach of instrumenting the application in such a way as to precompute the
possible paths, collecting the complete path trace, and then post-processing it would
not scale well for long-running applications. So I set out to try to achieve a
dynamic variant. The first attempt was as an ATOM tool for Alpha, but had a variety
of problems. The sources for these (and other) ATOM tools are
here. Eventually, I was able to implement a more dynamic
system (in C as a PIN tool) - the basic approach is to observe that a path
can be represented as a cycle of Basic Blocks, and the addresses of the Bbs would be
sufficient to construct the paths. This would be very lightweight in terms of
instrumentation-time overhead. The dynamic compression portion of the problem was
an additional challenge, as it would seem to be desirable to carry and save enough
context to enable playback starting at an approximately arbitrary instruction without
having to decompress the entire trace, or decompress starting from the beginning of the
trace.
The resultant content (and some additional notes) are:
-
Dynamic Whole Program Profiling: dynamic whole program
[path] profiling.
There is also a version on AMD's web site someplace - AMD moves content around on their
web site to enable listing a URL here.
Sources for the original (written in C) PIN-tool dynamic whole program path profiler.
tool and extraction utilities: csources.tar.gz
Via the dynamic approach, it is possible to store the entirety of SPEC CPU2006 instruction
path traces in both temporally preserving, and lossless means. It was done on a system
with 8GB of memory, and consumes a net of just under 160GB of disk space.
-
Isometric Paths: some notes about Isometric Paths. Also in
ODF format.
As part of an exercise to significantly improve my C++ skills, a from-scratch rewrite
was undertaken of the original tooling, and with the intent of investigating the possibility
of capturing entire data address access traces via the same general compression approach.
The code for that set of tools is newpathp.tar.gz.
With this, I can capture information about the nature of various paths - two of the
logfiles from running whetstone are: whet.5266.ipath.log
and whet.5266.istrata.log.
A subset of SPEC CPU2006 was run with and without the path profiler, three runs each
Overhead for non-temporal path collection:
| Benchmark | Ref ratio | Path profiler ratio | Overhead |
| 400.perlbench | 26.5 | 0.505 | 52x |
| 401.bzip2 | 20.4 | .714 | 28x |
| 458.sjeng | 20.9 | .348 | 60x |
Futures:
- Investigate making the path profiler into a valgrind tool
- Continue Investigations into collecting data address access traces
- Speeding up the path profiler (push more work into a child process)
If you find this useful for research purposes, I would appreciate hearing from you about it.
LWPtools: LightWeight Profiling
LightWeight Profiling is very low overhead, per-thread, user-space profiling mechanism
designed by AMD. One of the key aspects is the capability of performing
value profiling.
LWP is currently implemented in a number of their shipping processors (as of 2013). Until
now, there does not seem to have been any sort of wrapper library to simplify development
of performance tools based upon this feature, and thus, this page.
This library is licensed under the GPL. Contact me if you wish to discuss the
availability of the library under different licensing terms.
- 9-April-2013: LWPtools-0.8.6 (GPL)
Slight changes, some defensive coding around requiring an LWPStop() prior to release
of the ring buffer.
- 9-April-2013: A source patch to add LWP support to Valgrind
(SVN version) has been created. That patch is at
https://bugs.kde.org/show_bug.cgi?id=317441.
- 18-March-2013: A Unified Linux Kernel patch to
enable LWP in the Linux 3.1 kernel.
This is a patch in 'patch' form. This is the work done by Hans Rosenfeld at
http://thread.gmane.org/gmane.linux.kernel/1221963,
in Nov. 2011, with additional changes to complete the enablement of LWP.
Unfortunately, I was unable to make the referenced patch set successfully install via git
due to a number of cases where the patch had a leading space before a tab, while the
source file started with a tab. Thus, a single unified patch.
- 10-March-2013: LWPtools-0.8.5 (GPL)
Renamed, scons building, LWPINS and LWPVAL support, minimal ring buffer management.
Added an example. Uses GPL as the license.
- 20-Feb-2013: Initial version (removed, obsolete) 64-bit Linux, no scons content
to enable building. Includes a simple C++ program to scan the specific features available
to developers. It does not have any ring buffer management code in place. A very
light-weight wrapper.
LWP Futures:
- Develop more sophisticated tools on top of this
- Plugin to one or more of PIN, valgrind, DynINst, PAPI, SciDac:libmonitor, etc.
- Some sort of consumer code (perhaps a modified version of CodeAnalyst)
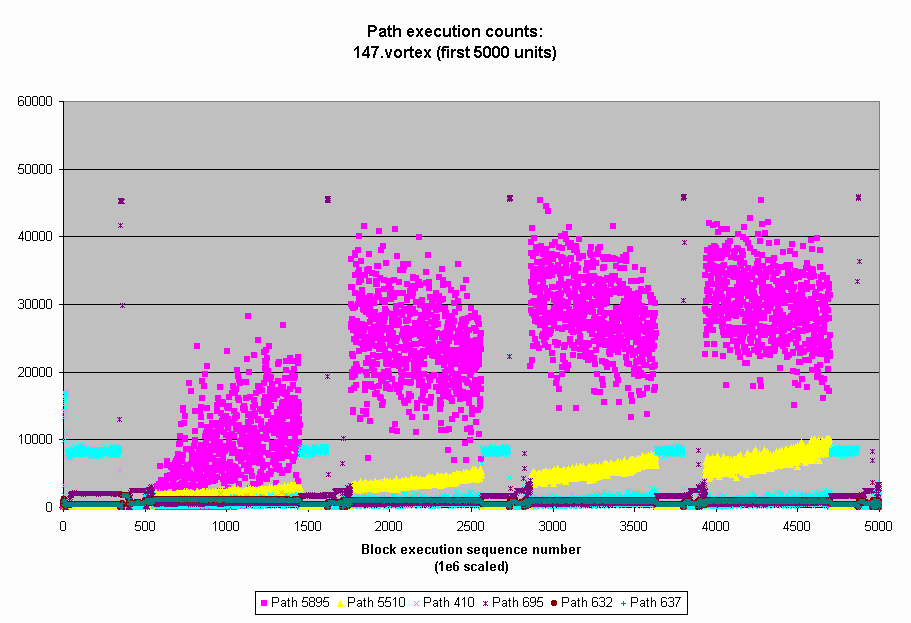
Phase Changes by applications
Various research publications have shown that applications change phases during the
course of their runs; to a code transformation/optimization system, having more context
enables more opportunities for code improvement. Paths are one way to represent
these phase changes. I collected some experimental results
via a binary instrumentation toolkit called ATOM a number of years ago.
The full page of those ATOM tools and more results.
Here is a gif of the phase plot of for some of the hot paths:

Technical References
Various publications have shown that it is possible to capture entire application (istream)
traces in a compact, lossless form. Some of the relevant publications include:
- Whole Program Paths by Larus, 1999.
- PP: A Path Profiling Tool by Ammons, Ball, Larus, 1999
- Efficient Path Profiling by Larus, 1997
- Interprocedural Path Profiling by Melski, Reps, 1999
- Variational Path Profiling by Perelman, Chilimbi, Calder, 2005
- Practical Path Profiling for Dynamic Optimizers by Bond, McKinley, 2005
- Preferential Path Profiling: Compactly Numbering Interesting Paths by Vaswani, Nori, Chilimbi, 2007
Copyright 2004 - 2015 Richard Gorton - rcgorton@verizon.net
Please Contact me if you wish to use any of the code on this page for commercial purposes.
